Datadog
Overview
Section titled “Overview”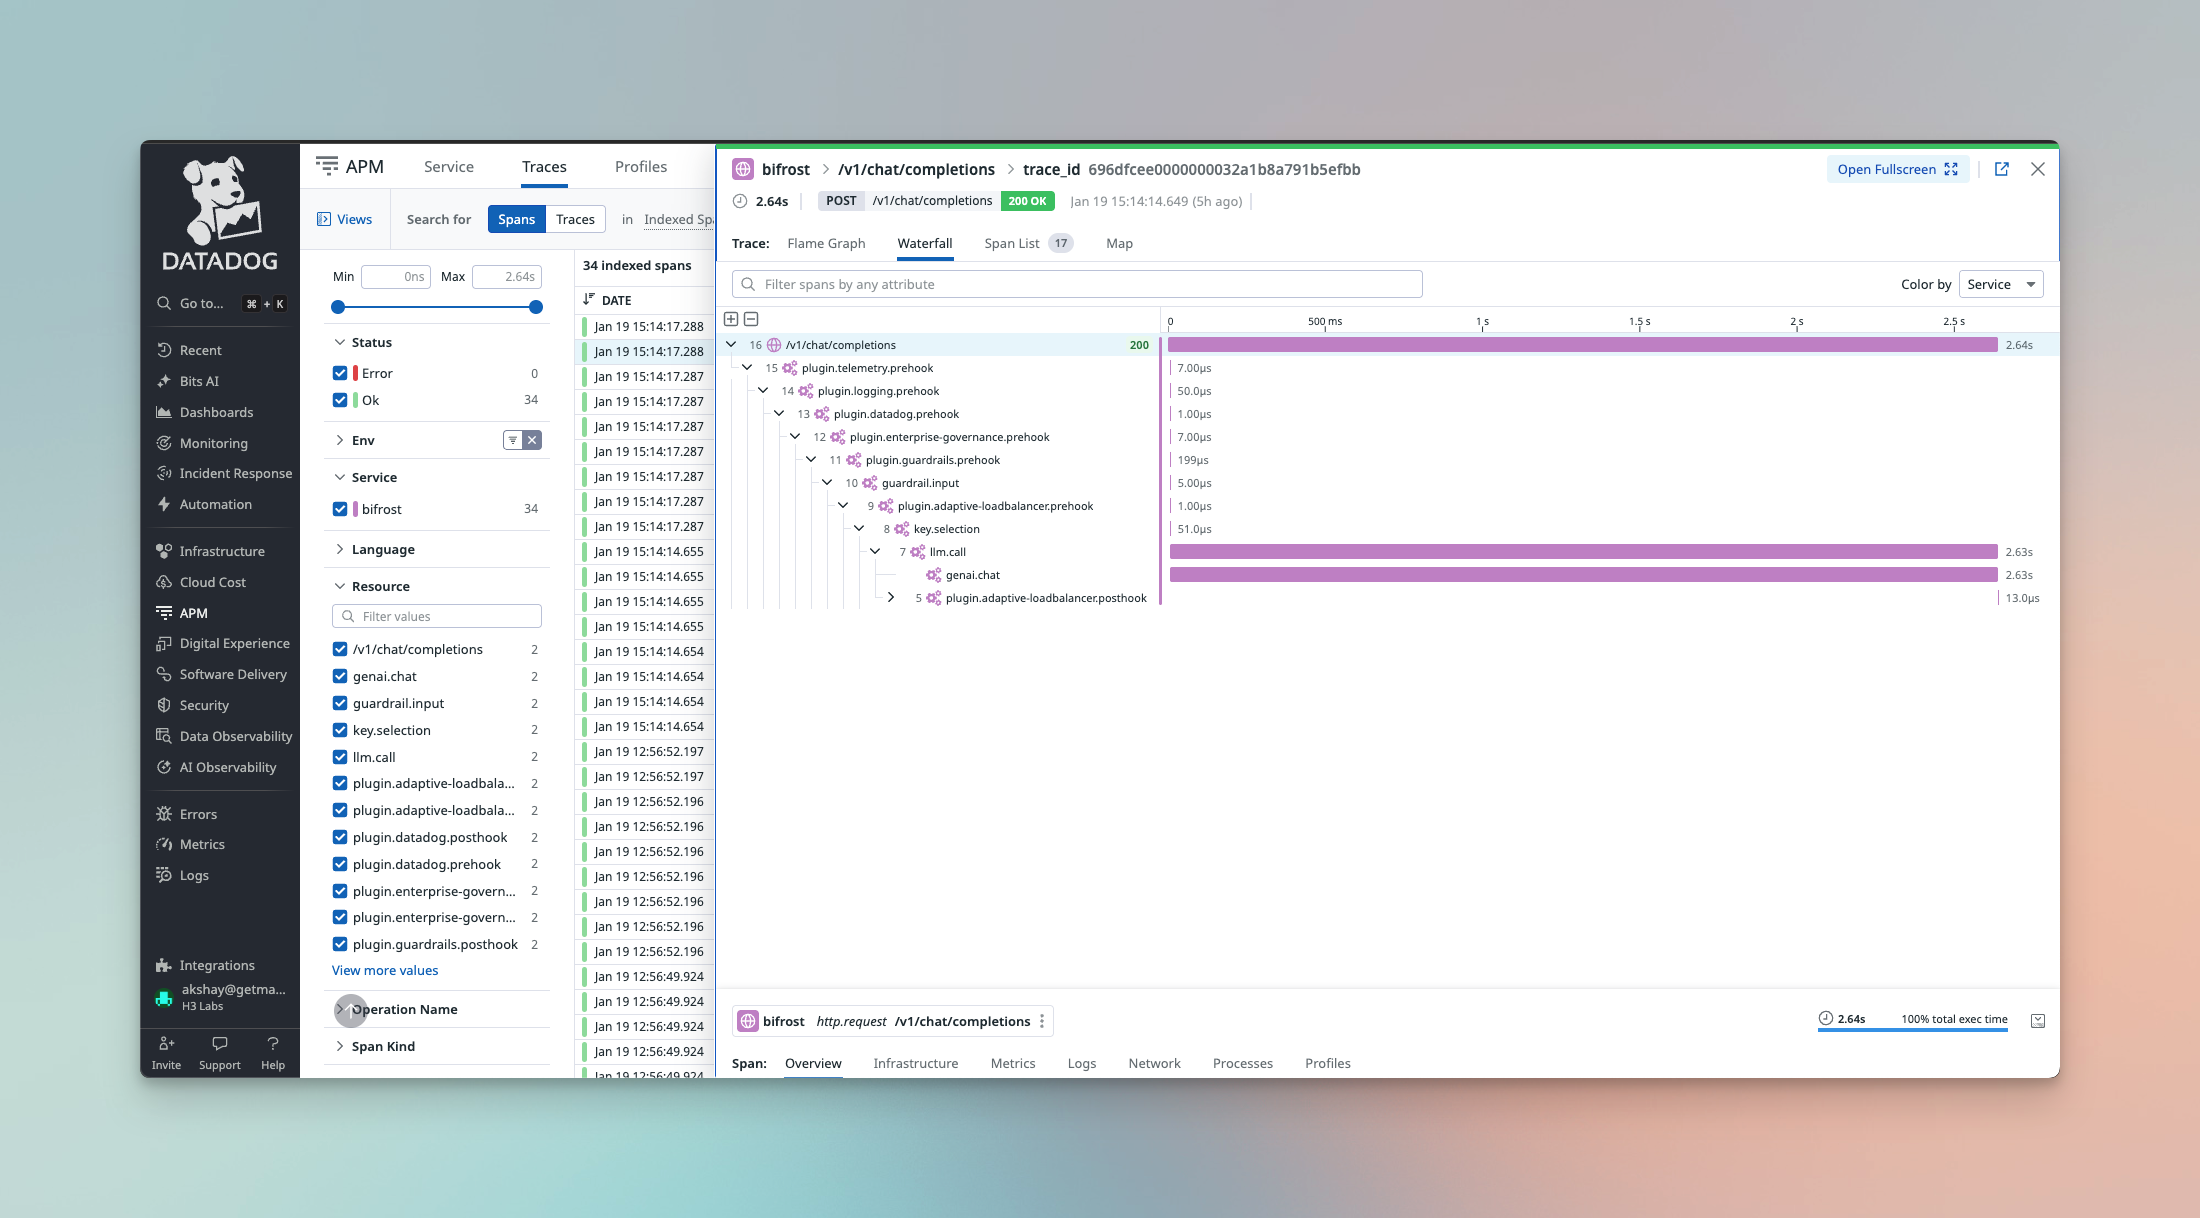
The Datadog plugin provides native integration with the Datadog observability platform, offering three pillars of observability for your LLM operations:
- APM Traces - Distributed tracing via dd-trace-go v2 with W3C Trace Context support for end-to-end request visibility
- LLM Observability - Native Datadog LLM Obs integration for AI/ML-specific monitoring
- Metrics - Operational metrics via DogStatsD or the Metrics API
Unlike the OTel plugin which sends generic OpenTelemetry data, the Datadog plugin leverages Datadog’s native SDKs for richer integration with Datadog-specific features like LLM Observability dashboards and ML App grouping.
Deployment Modes
Section titled “Deployment Modes”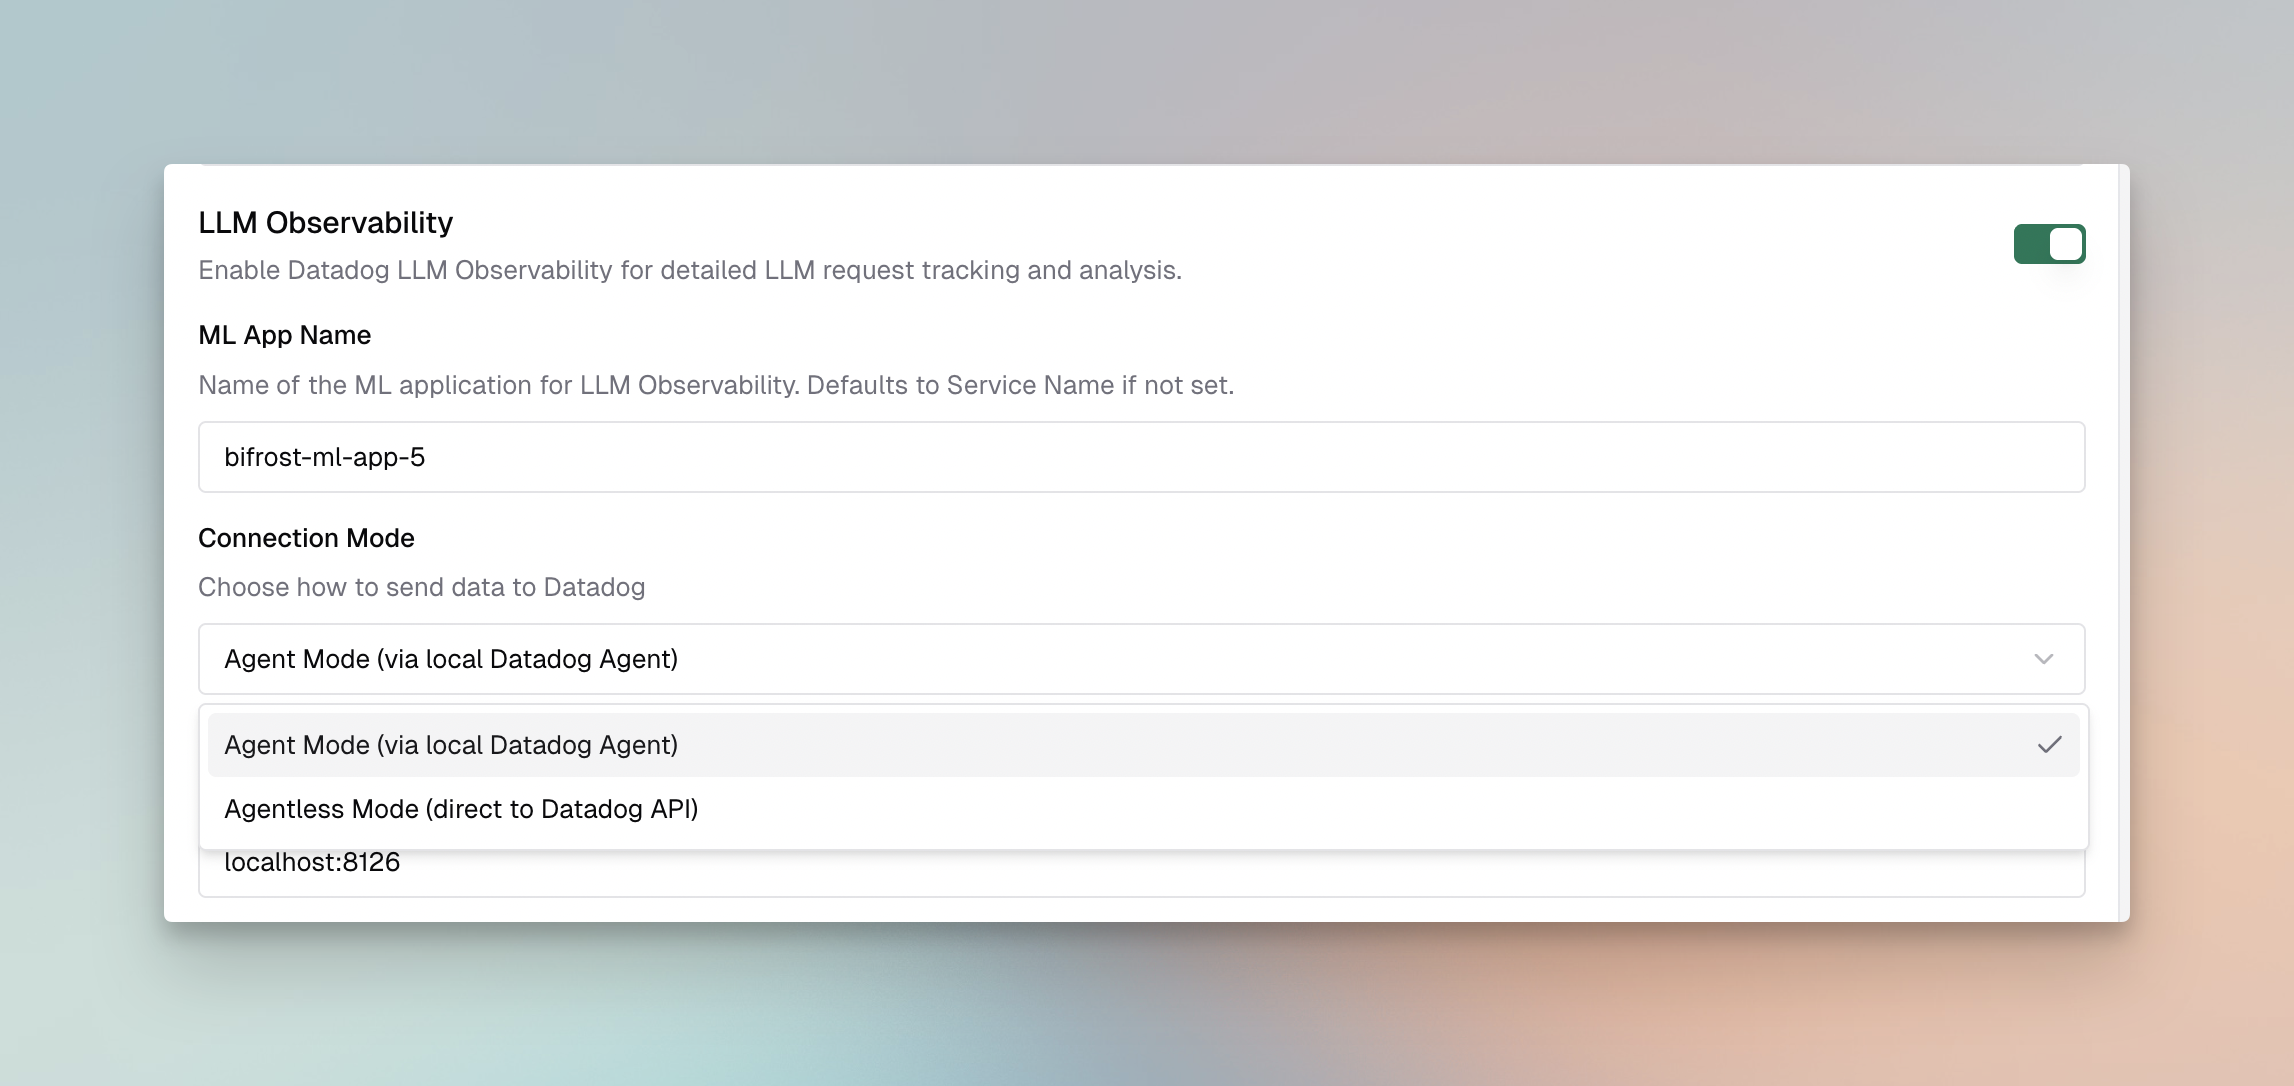
The plugin supports two deployment modes:
| Mode | Description | Requirements | Best For |
|---|---|---|---|
| Agent (default) | Sends data through a local Datadog Agent | Datadog Agent running on host | Production deployments with existing agent infrastructure |
| Agentless | Sends data directly to Datadog APIs | API key only | Serverless, containers, or simplified deployments |
Agent Mode
Section titled “Agent Mode”In agent mode, the plugin communicates with a locally running Datadog Agent:
- APM Traces → Agent at
localhost:8126 - Metrics → DogStatsD at
localhost:8125
The agent handles batching, retries, and provides lower latency. This is the recommended mode for production deployments where you already have the Datadog Agent installed.
Agentless Mode
Section titled “Agentless Mode”In agentless mode, the plugin sends data directly to Datadog’s intake APIs:
- APM Traces →
https://trace.agent.{site} - LLM Observability → Direct API submission
- Metrics → Datadog Metrics API
This mode requires an API key but simplifies deployment by eliminating the need for a local agent. Ideal for serverless environments, Kubernetes pods, or quick testing.
Configuration
Section titled “Configuration”Required Fields
Section titled “Required Fields”| Field | Type | Required | Default | Description |
|---|---|---|---|---|
service_name | string | No | deepintshield | Service name displayed in Datadog APM |
ml_app | string | No | (uses service_name) | ML application name for LLM Observability grouping |
agent_addr | string | No | localhost:8126 | Datadog Agent address (agent mode only) |
dogstatsd_addr | string | No | localhost:8125 | DogStatsD server address (agent mode only) |
env | string | No | - | Environment tag (e.g., production, staging) |
version | string | No | - | Service version tag |
custom_tags | object | No | - | Additional tags for all traces and metrics |
enable_metrics | bool | No | true | Enable metrics emission |
enable_traces | bool | No | true | Enable APM traces |
enable_llm_obs | bool | No | true | Enable LLM Observability |
agentless | bool | No | false | Use agentless mode (direct API) |
api_key | EnvVar | Agentless only | - | Datadog API key (supports env.VAR_NAME) |
site | string | No | datadoghq.com | Datadog site/region |
Environment Variable Substitution
Section titled “Environment Variable Substitution”The api_key and custom_tags fields support environment variable substitution using the env. prefix:
{ "api_key": "env.DD_API_KEY", "custom_tags": { "team": "env.TEAM_NAME", "cost_center": "env.COST_CENTER" }}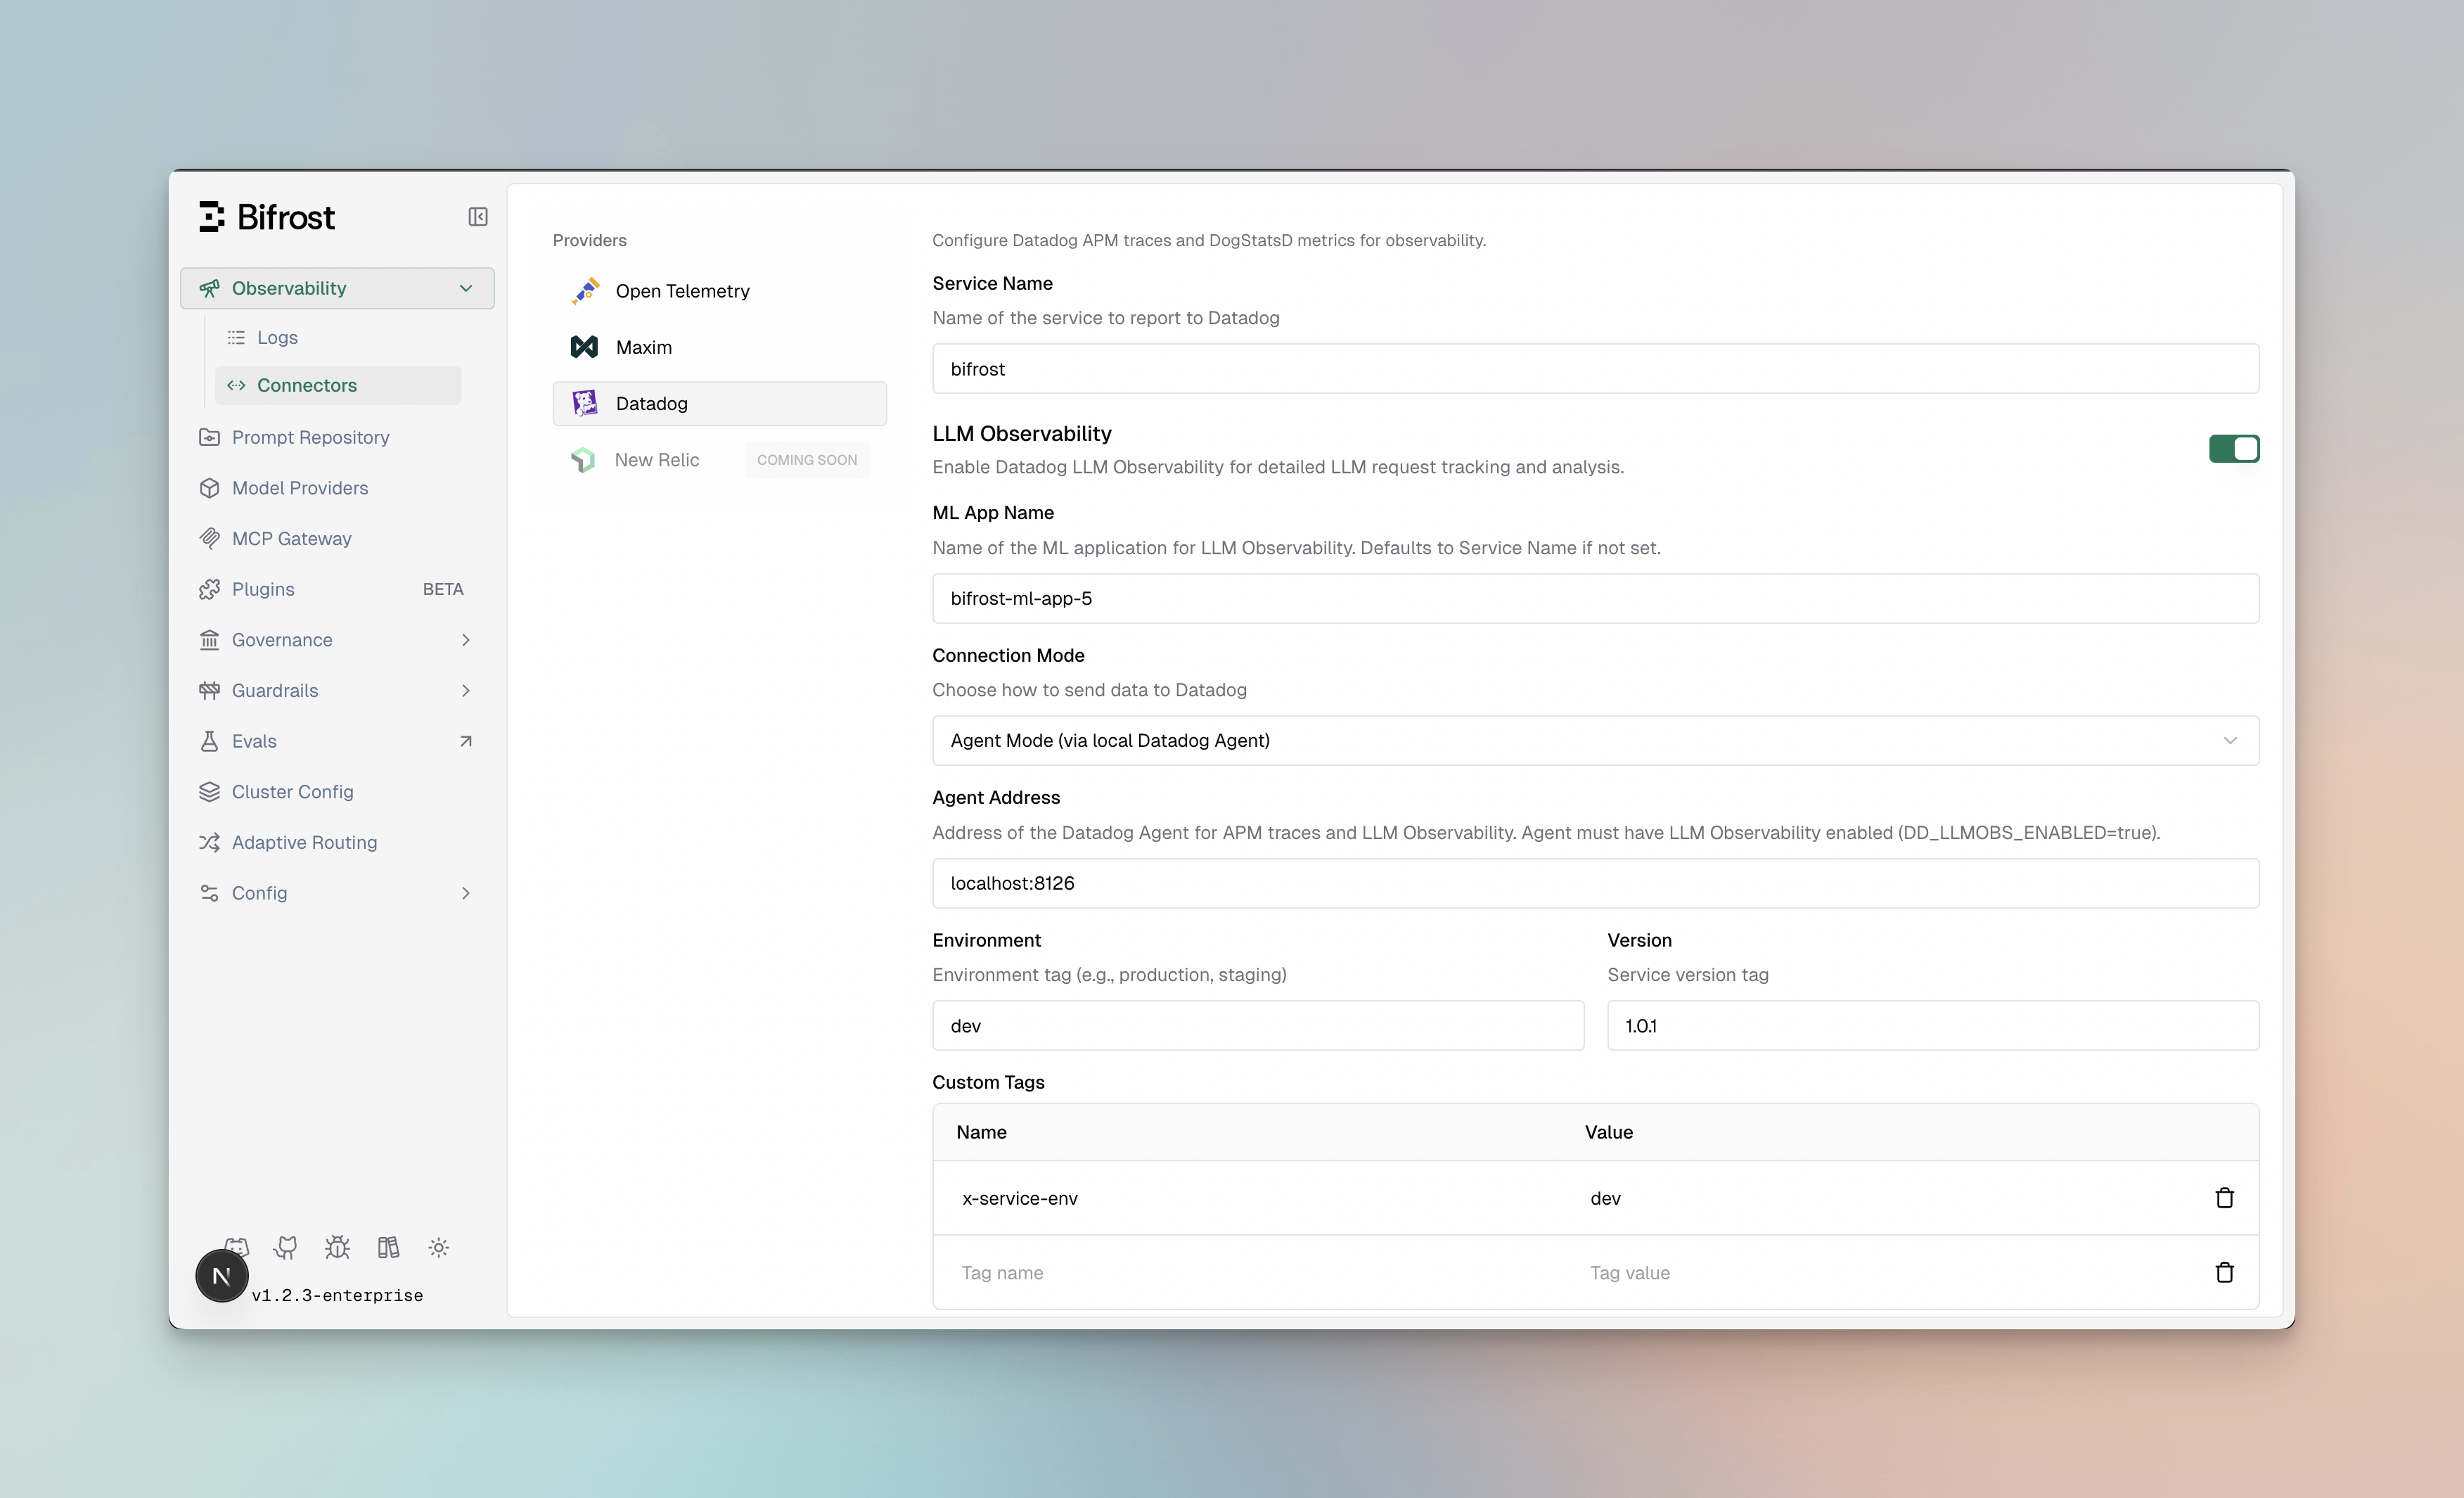
Configure the Datadog plugin through the DeepIntShield UI:
- Navigate to Settings → Plugins
- Enable the Datadog plugin
- Configure the required fields based on your deployment mode
package main
import (    "context"    deepintshield "github.com/maximhq/deepintshield/core"    "github.com/maximhq/deepintshield/core/schemas"    "github.com/maximhq/deepintshield/framework/modelcatalog"    datadog "github.com/maximhq/deepintshield-enterprise/plugins/datadog")
func main() {    ctx := context.Background()    logger := schemas.NewLogger()
    // Initialize model catalog (required for cost calculation)    modelCatalog := modelcatalog.NewModelCatalog(logger)
    // Agent mode configuration    ddPlugin, err := datadog.Init(ctx, &datadog.Config{        ServiceName: "my-llm-service",        Env:         "production",        Version:     "1.0.0",        CustomTags: map[string]string{            "team": "platform",        },    }, logger, modelCatalog, "1.0.0")    if err != nil {        panic(err)    }
    // Initialize DeepIntShield with the plugin    client, err := deepintshield.Init(ctx, schemas.DeepIntShieldConfig{        Account: &yourAccount,        Plugins: []schemas.Plugin{ddPlugin},    })    if err != nil {        panic(err)    }    defer client.Shutdown()
    // All requests are now traced to Datadog}
For agentless mode:
// Agentless mode configurationenableAgentless := trueddPlugin, err := datadog.Init(ctx, &datadog.Config{ ServiceName: "my-llm-service", Env: "production", Agentless: &enableAgentless, APIKey: &schemas.EnvVar{EnvVarName: "DD_API_KEY"}, Site: "datadoghq.com",}, logger, modelCatalog, "1.0.0")Agent Mode (Minimal)
Section titled “Agent Mode (Minimal)”{ "plugins": [ { "enabled": true, "name": "datadog", "config": { "service_name": "deepintshield", "env": "production" } } ]}Agent Mode (Full Configuration)
Section titled “Agent Mode (Full Configuration)”{ "plugins": [ { "enabled": true, "name": "datadog", "config": { "service_name": "my-llm-gateway", "ml_app": "my-ml-application", "agent_addr": "localhost:8126", "dogstatsd_addr": "localhost:8125", "env": "production", "version": "1.2.3", "custom_tags": { "team": "platform", "cost_center": "env.COST_CENTER" }, "enable_metrics": true, "enable_traces": true, "enable_llm_obs": true } } ]}Agentless Mode
Section titled “Agentless Mode”{ "plugins": [ { "enabled": true, "name": "datadog", "config": { "service_name": "my-llm-gateway", "env": "production", "agentless": true, "api_key": "env.DD_API_KEY", "site": "datadoghq.com" } } ]}Set the environment variable:
export DD_API_KEY="your-datadog-api-key"Datadog Sites
Section titled “Datadog Sites”The plugin supports all Datadog regional sites. Set the site field to match your Datadog account region:
| Site | Region | Value |
|---|---|---|
| US1 (default) | United States | datadoghq.com |
| US3 | United States | us3.datadoghq.com |
| US5 | United States | us5.datadoghq.com |
| EU1 | Europe | datadoghq.eu |
| AP1 | Asia Pacific (Japan) | ap1.datadoghq.com |
| AP2 | Asia Pacific (Australia) | ap2.datadoghq.com |
| US1-FED | US Government | ddog-gov.com |
LLM Observability
Section titled “LLM Observability”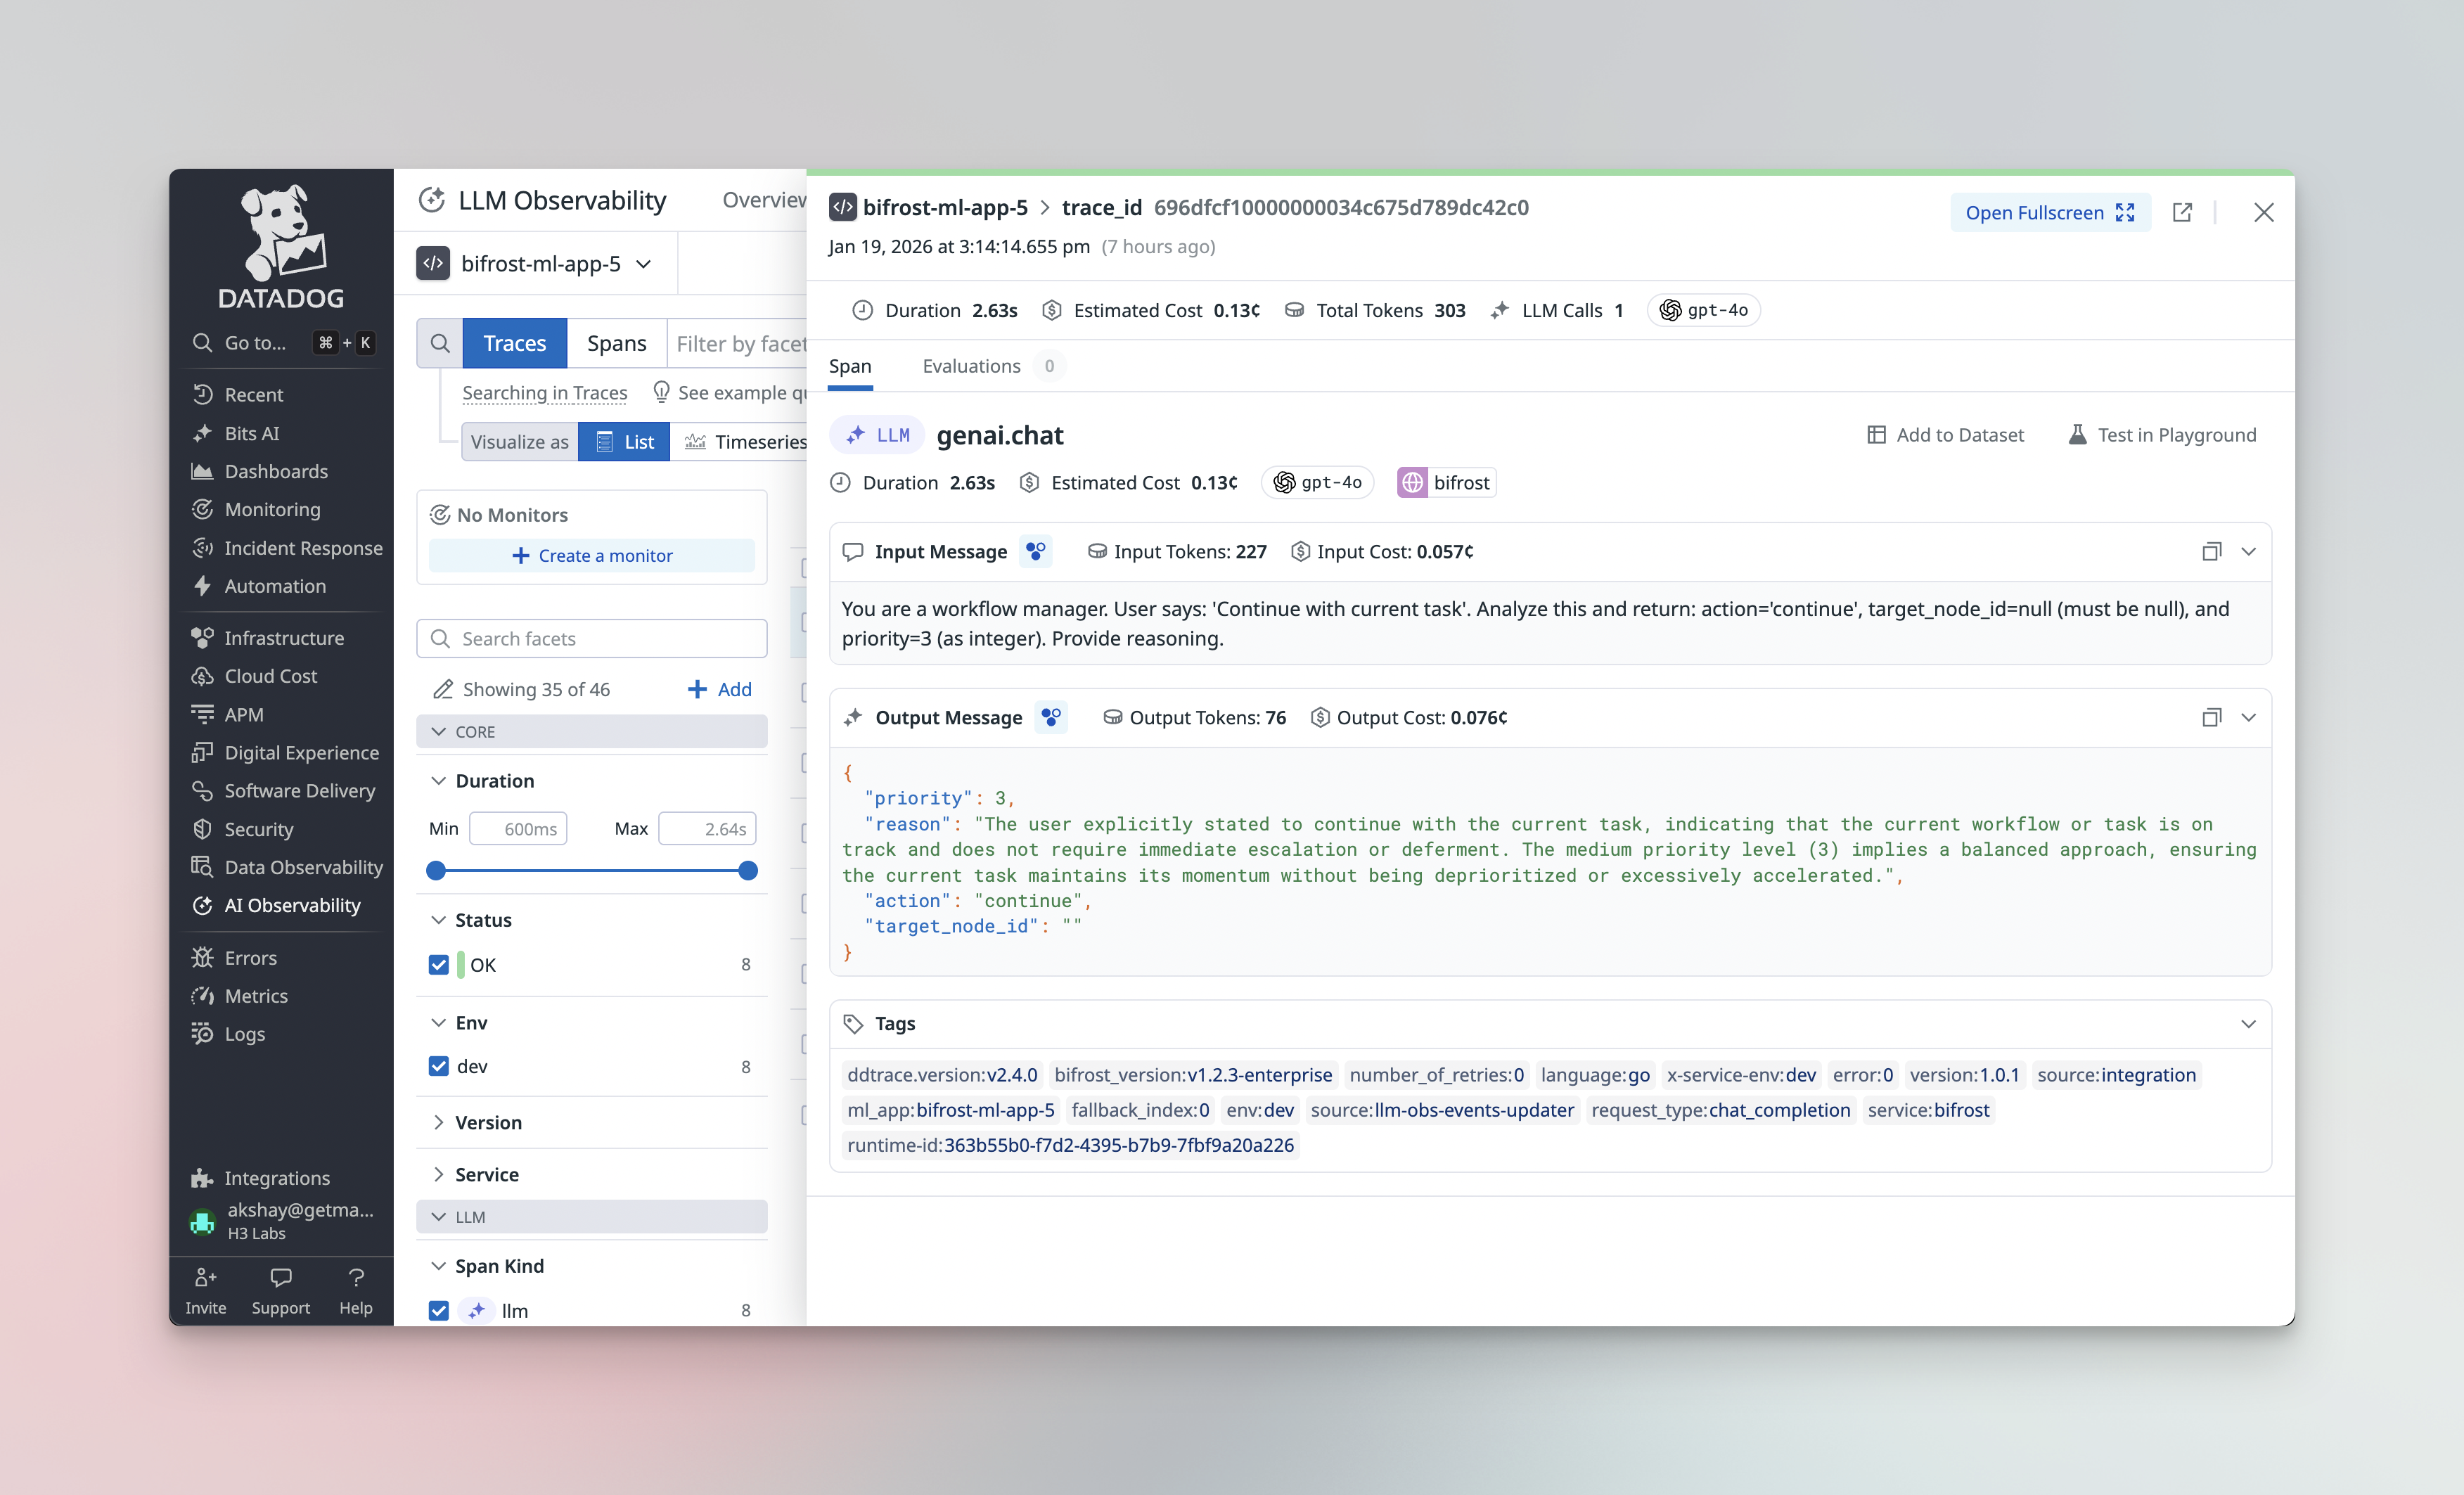
The Datadog plugin integrates with Datadog LLM Observability to provide AI/ML-specific monitoring capabilities.
ML App Grouping
Section titled “ML App Grouping”LLM traces are grouped under an ML App in Datadog. By default, this uses your service_name, but you can specify a dedicated ML App name:
{ "service_name": "deepintshield-gateway", "ml_app": "customer-support-ai"}This allows you to:
- Group related LLM operations across multiple services
- Track costs and performance by application
- Apply ML-specific alerts and dashboards
Session Tracking
Section titled “Session Tracking”The plugin supports session tracking via the x-bf-session-id header. Include this header in your requests to group related LLM calls into a conversation session:
curl -X POST https://your-deepintshield-gateway/v1/chat/completions \ -H "Authorization: Bearer $API_KEY" \ -H "x-bf-session-id: user-123-session-456" \ -d '{...}'Sessions appear in Datadog LLM Observability, allowing you to trace entire conversation flows.
W3C Distributed Tracing
Section titled “W3C Distributed Tracing”The plugin supports W3C Trace Context for distributed tracing across services. When your upstream service sends a traceparent header, DeepIntShield automatically links its spans as children of the parent trace.
curl -X POST https://your-deepintshield-gateway/v1/chat/completions \ -H "Authorization: Bearer $API_KEY" \ -H "traceparent: 00-0af7651916cd43dd8448eb211c80319c-b7ad6b7169203331-01" \ -d '{...}'This enables:
- End-to-end visibility - See LLM calls in the context of your full application trace
- Cross-service correlation - Link frontend requests → backend services → DeepIntShield → LLM providers
- Latency attribution - Understand how LLM latency contributes to overall request time
The traceparent header format follows the W3C standard:
traceparent: {version}-{trace-id}-{parent-id}-{trace-flags}All Datadog APM spans created by DeepIntShield will be linked to the parent span, appearing as children in the Datadog trace view.
What’s Captured
Section titled “What’s Captured”For each LLM operation, the plugin sends to LLM Observability:
- Input/Output Messages - Full conversation history with role attribution
- Token Usage - Input, output, and total token counts
- Cost - Calculated cost in USD based on model pricing
- Latency - Request duration and time-to-first-token for streaming
- Model Info - Provider, model name, and request parameters
- Tool Calls - Function/tool call details for agentic workflows
Metrics Reference
Section titled “Metrics Reference”The plugin emits the following metrics to Datadog:
| Metric | Type | Description | Tags |
|---|---|---|---|
deepintshield.requests.total | Counter | Total LLM requests | provider, model, request_type |
deepintshield.success.total | Counter | Successful requests | provider, model, request_type |
deepintshield.errors.total | Counter | Failed requests | provider, model, request_type, reason |
deepintshield.latency.seconds | Histogram | Request latency distribution | provider, model, request_type |
deepintshield.tokens.input | Counter | Input/prompt tokens consumed | provider, model |
deepintshield.tokens.output | Counter | Output/completion tokens generated | provider, model |
deepintshield.tokens.total | Counter | Total tokens (input + output) | provider, model |
deepintshield.cost.usd | Gauge | Request cost in USD | provider, model |
deepintshield.cache.hits | Counter | Cache hits | provider, model, cache_type |
deepintshield.stream.first_token_latency | Histogram | Time to first token (streaming) | provider, model |
deepintshield.stream.inter_token_latency | Histogram | Inter-token latency (streaming) | provider, model |
Custom Tags
Section titled “Custom Tags”All metrics include your configured custom_tags plus automatic tags for:
provider- LLM provider (openai, anthropic, etc.)model- Model namerequest_type- Type of request (chat, embedding, etc.)env- Environment from configuration
Captured Data
Section titled “Captured Data”Each APM trace includes comprehensive LLM operation metadata:
Span Attributes
Section titled “Span Attributes”- Span Name - Based on request type (
genai.chat,genai.embedding, etc.) - Service Info -
service.name,service.version,env - Provider & Model -
gen_ai.provider.name,gen_ai.request.model
Request Parameters
Section titled “Request Parameters”- Temperature, max_tokens, top_p, stop sequences
- Presence/frequency penalties
- Tool configurations and parallel tool calls
- Custom parameters via
ExtraParams
Input/Output Data
Section titled “Input/Output Data”- Complete chat history with role-based messages
- Prompt text for completions
- Response content with role attribution
- Tool calls and results
- Reasoning and refusal content (when present)
Performance Metrics
Section titled “Performance Metrics”- Token usage (prompt, completion, total)
- Cost calculations in USD
- Latency and timing (start/end timestamps)
- Time to first token (streaming)
- Error details with status codes
DeepIntShield Context
Section titled “DeepIntShield Context”- Virtual key ID and name
- Selected key ID and name
- Team ID and name
- Customer ID and name
- Retry count and fallback index
Supported Request Types
Section titled “Supported Request Types”The Datadog plugin captures all DeepIntShield request types:
| Request Type | Span Name | LLM Obs Type |
|---|---|---|
| Chat Completion | genai.chat | LLM Span |
| Chat Completion (streaming) | genai.chat | LLM Span |
| Text Completion | genai.text | LLM Span |
| Text Completion (streaming) | genai.text | LLM Span |
| Embeddings | genai.embedding | Embedding Span |
| Speech Generation | genai.speech | Task Span |
| Speech Generation (streaming) | genai.speech | Task Span |
| Transcription | genai.transcription | Task Span |
| Transcription (streaming) | genai.transcription | Task Span |
| Responses API | genai.responses | LLM Span |
| Responses API (streaming) | genai.responses | LLM Span |
When to Use
Section titled “When to Use”Datadog Plugin
Section titled “Datadog Plugin”Choose the Datadog plugin when you:
- Use Datadog as your primary observability platform
- Want native LLM Observability integration with ML App grouping
- Need seamless correlation with existing Datadog APM traces via W3C distributed tracing
- Require Datadog-specific features like notebooks and dashboards
- Want session tracking for conversation flows
vs. OTel Plugin
Section titled “vs. OTel Plugin”Use the OTel plugin when you:
- Need multi-vendor observability (send to multiple backends)
- Are using Datadog via an OpenTelemetry Collector
- Want vendor flexibility to switch backends without code changes
- Prefer standardized OpenTelemetry semantic conventions
vs. Built-in Observability
Section titled “vs. Built-in Observability”Use Built-in Observability for:
- Local development and testing
- Simple self-hosted deployments
- No external dependencies required
- Direct database access to logs
Troubleshooting
Section titled “Troubleshooting”Agent Connectivity Issues
Section titled “Agent Connectivity Issues”Verify the Datadog Agent is running and accessible:
# Check agent statusdatadog-agent status
# Test APM endpointcurl -v http://localhost:8126/info
# Test DogStatsD (should accept UDP packets)echo "test.metric:1|c" | nc -u -w1 localhost 8125
Agentless Mode Not Working
Section titled “Agentless Mode Not Working”- Verify your API key is valid:
curl -X GET "https://api.datadoghq.com/api/v1/validate" \ -H "DD-API-KEY: $DD_API_KEY"-
Ensure the
sitematches your API key’s region -
Check that the API key environment variable is set:
echo $DD_API_KEYMissing Traces
Section titled “Missing Traces”- Enable debug logging in DeepIntShield:
deepintshield-http --log-level debug- Verify traces are enabled in your configuration:
{ "enable_traces": true, "enable_llm_obs": true}- Check for errors in the DeepIntShield logs related to the Datadog plugin
Missing Metrics
Section titled “Missing Metrics”- Verify DogStatsD is running (agent mode):
datadog-agent status | grep DogStatsD- Ensure metrics are enabled:
{ "enable_metrics": true}- For agentless mode, verify your API key has metrics submission permissions
LLM Observability Not Appearing
Section titled “LLM Observability Not Appearing”- LLM Observability requires
enable_llm_obs: true(default) - Verify your Datadog plan includes LLM Observability
- Check the ML App name in Datadog under LLM Observability → Applications
Next Steps
Section titled “Next Steps”- OTel Plugin - OpenTelemetry integration for multi-vendor observability
- Built-in Observability - Local logging for development
- Telemetry - Prometheus metrics and dashboards